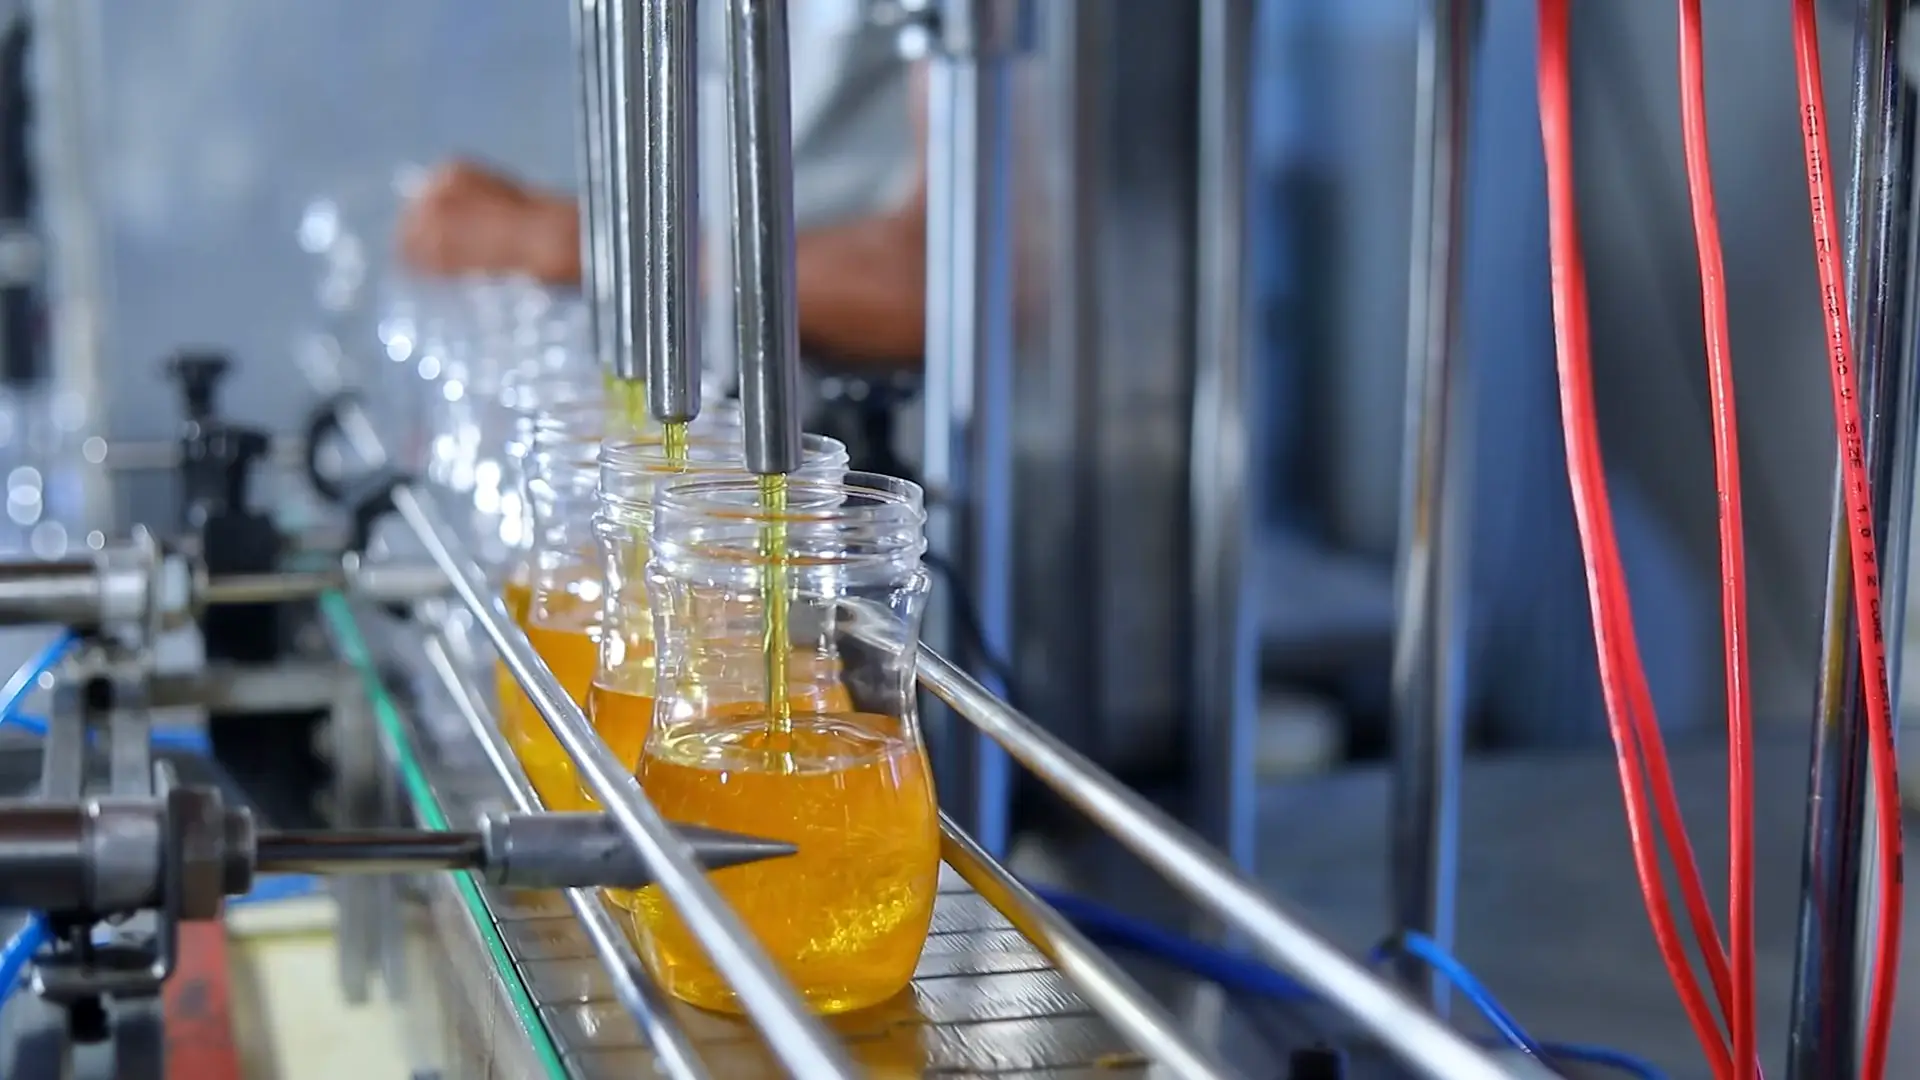
What is Operational Excellence?
Operational excellence is the discipline of producing more and better with the same resources: less waste, stable processes and teams that solve problems where they occur.
We combine lean principles with operations analytics. We measure where capacity, cost and quality are lost, redesign processes with the plant team and leave indicators and routines in place so that improvement doesn’t depend on a project.
We work in plants, distribution centers and service operations, always on the floor and with those who operate, because that is where change holds.
The problems clients bring us
Why isn’t the plant performing as it should?
Stoppages, slow changeovers and speed losses that nobody measures systematically.
Are our costs growing faster than sales?
Conversion, energy and labor costs that rise without a clear explanation by process.
Does quality depend on who is on shift?
Processes without standards, rework and complaints that recur because the root cause isn’t addressed.
Do we have operational data but don’t use it?
Machine and system information that doesn’t reach day-to-day decisions.
Are improvements lost when the project ends?
Initiatives that work for a few months and then fade because there are no routines or owners.
How do we grow without investing in more capacity?
Growing demand and an operation that could free up capacity before buying new equipment.
Our approach, applied to Operational Excellence
The same four phases of «Our approach», with what we do and what we deliver in each one.
The path of an operational excellence program
- 01Plant walkShift observation and production data with the operations team.
- 02Loss mapWhere and why capacity, cost and quality are lost.
- 03Pilot in a model areaImprovements tested on a line with those who run it.
- 04Standards and daily managementDocumented processes, shift dashboards and problem solving.
- 05ReplicationSequence for taking the improvements to the remaining lines and plants.
We use a problem-solving structure to frame hypotheses.
Plant walks, shift observation and production data analysis to quantify where capacity, cost and quality are lost. Findings are validated with the operations team.
DeliverableLoss mapWe break the problem down into a MECE structure.
Losses are grouped by type and cause in a MECE structure and connected to specific levers: standardization, quick changeovers, maintenance, flow or automation.
DeliverableLoss tree and prioritized leversWe build the business cases and the structure of each initiative.
Pilots on model lines or areas with the plant team. Each improvement is documented as a standard and turned into a business case before being replicated.
DeliverableProcess redesignWe provide support with a dedicated, full-time on-site team within the organization.
Dashboards by shift, line and plant, daily performance meetings and a problem-solving routine led by the client’s team.
DeliverableOperating KPIs
What does the diagnosis review?
Value stream with its losses
- 01Receipt of inputsWaiting and accumulated inventory
- 02PreparationSlow changeovers
- 03BottleneckProductionStoppages and speed losses
- 04Quality controlDefects and rework
- 05Packing and dispatchMovements and work-in-process inventory
- Asset productivityAvailability, performance and quality of lines and equipment.
- Flow and processesBottlenecks, work-in-process inventory and cycle times.
- QualityDefects, rework and stability of critical processes.
- Conversion costsLabor, energy, inputs and maintenance per unit.
- Performance managementIndicators, shift meetings and problem solving.
- People and capabilitiesRoles, skills and a culture of continuous improvement in operations.
How is improvement sustained?
Each improvement goes through a cycle that ends in a standard, and a daily management system protects it with clear decision levels and cadences.
The continuous improvement cycle
- 01Measure the loss
- 02Analyze the root cause
- 03Pilot in a model area
- 04Standard
- 05Replication
- Indicator review
Performance management system
What stays in your organization
- Loss map
- Where and why capacity, cost and quality are lost, prioritized by impact.
- Process redesign
- Standard processes in the model areas, ready to be replicated across the rest of the operation.
- Operating KPIs
- Indicators by shift, line and plant connected with the company’s targets.
- Daily management system
- Short meetings, visual boards and problem escalation with clear owners.
- Replication plan
- Sequence for taking the improvements to the remaining lines and plants.
- Capability transfer
- Operations leaders trained in lean and problem solving.
Where do we apply it?
Led by Benká Consulting, with the rest of the holding when the challenge calls for it.